Cost Curve Comparisons
The Old Book Model of publishing is antiquated and vulnerable to a new, more attractive model to take its place. What will that new model be? I do not have a crystal ball to say for certain what it will be. All I know is that printing 3,000-5,000 copies of an untested book and trying to sell them through the existing distribution chain is less and less attractive.
Today, there are many short-run, digital printing solutions available to publishers. The opportunity exists to print a smaller quantity, 500-1,500 copies, and market them. The total expenditure to print fewer books leaves more money available to market the books. Then, if the book sells well, the publisher can return to the printer for another printing.
The prevailing wisdom in the book-publishing world has been to print between 3,000-5,000 copies at the first printing to keep the unit cost of each book as low as possible. Publishers know how much money they must give to the distribution channel to get the books into bookstores (70% of the list price). Keeping the unit cost low was one way to maximize profit. What happens when the books didn't sell, though? Most often, the books are sold in remainder stores or destroyed–a waste of the publisher's money.
In the old model, the exorbitant set-up costs for the printing press and bindery made printing smaller quantities expensive. If the set-up costs are spread over 3,000-5,000 copies, however, they are much lower and the price-per-book is more attractive.
Digital printing equipment and new bindery equipment make producing smaller quantities of books possible. The new equipment requires less set-up time and expense, so the set-up costs can be spread over a smaller number of books. The cost curve for digital printing flattens out quickly, however, and traditional presses and binders become more cost effective at about 2,000-2,500 books. See the diagram below to compare the cost curves of three printing methods: traditional, Print on Demand (POD) and digital (labeled Print Quantity Needed or PQN). The left axis of the diagram is cost. The bottom axis of the diagram is number of books.
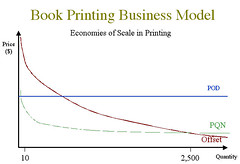
The large curve in the diagram represents the traditional printing cost curve. It starts out very high because of the large set-up costs but drops quickly as the number of books increases. The flat curve is the Print on Demand (POD) curve. The cost-per-book with a POD printer remains the same regardless of the number of books a publisher buys. Xlibris and Lightning Source are two of the top POD printers. The smaller curve is the digital printing (Print Quantity Needed, PQN) curve. The set-up costs for digital printing are less than traditional printers so the cost-per-book is less from a digital printer for smaller quantities of books. The digital printing curve flattens out around 2,000-2.500 books and, at that point, traditional printing becomes more cost effective.
For many publishers the digital printing model is ideal. The shocking truth about book publishing is that most books print only 7,500 copies over the entire life of the book. That means for every John Grisham or Stephen King who sells millions of books, there are many publishers that only sell hundreds. Digital printing is designed for such publishers.
The future model of Book Publishing is uncertain. What is certain, however, is that digital book printing will be part of that future. Book printers who embrace the digital technology early will benefit from the new Book Model whenever it occurs.
posted by Bill Frank @ 7:21 PM
0 comments
![]()
![]()


0 Comments:
Post a Comment
<< Home